
The U.S. national debt has changed dramatically throughout American history, rising from tens of millions of dollars in the country's early years to more than $40 trillion at the end of fiscal year 2026.
For a consistent year-by-year comparison, this article uses total public debt outstanding at the end of each fiscal year, the measure reported by the U.S. Department of the Treasury. The Treasury's historical debt dataset extends back to 1789 and records the government's total outstanding debt for each historical reporting period.
At the end of fiscal year 2026, on September 30, 2026, total public debt outstanding was $40.17 trillion. That was an increase of about $2.53 trillion from the $37.64 trillion recorded at the end of fiscal year 2025.
The historical series shows that debt does not increase at a uniform rate. Wars, recessions, financial crises, tax and spending policies, economic conditions, and other federal financing needs have produced periods of rapid increases as well as periods when the outstanding debt declined.
U.S. National Debt by Fiscal Year, 1930 to 2026
Total public debt outstanding at the end of each fiscal year, in nominal U.S. dollars. Data are based on the U.S. Treasury's Historical Debt Outstanding series.
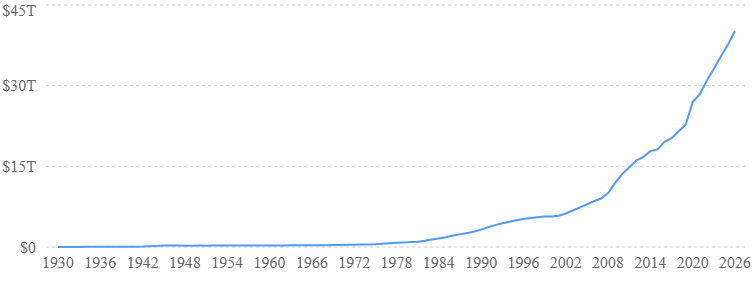
The table below presents a consistent annual series using the Treasury's total public debt outstanding measure. Amounts are shown in nominal dollars, meaning they have not been adjusted for inflation.
For the modern period, the fiscal year ends on September 30. Earlier U.S. fiscal-year conventions were different, so historical Treasury records have different reporting dates.
Source: U.S. Department of the Treasury, Bureau of the Fiscal Service, Historical Debt Outstanding. The underlying Treasury series reports total outstanding federal debt and provides the historical record dating back to the country's early years.
What Was the U.S. National Debt from 1790 to 1930?
The Treasury's historical series goes back much further than the 1930 starting point used in the main annual table.
However, the reporting dates changed over U.S. history, so simply putting every historical observation into a modern September 30 fiscal-year framework would be misleading.
According to Treasury's methodology:
1. From 1789 to 1842, the fiscal year began in January.
2. From 1842 until 1977, the fiscal year began in July.
3. From 1977 onward, the fiscal year began in October.
4. For records through 1919, Treasury generally presented debt outstanding as of the first day of the following fiscal year.
5. From 1920 onward, debt was presented as of the final day of the fiscal year.
For that reason, historical figures before 1930 should be read with their actual record dates rather than assuming that every observation represents September 30.
Some important early figures are shown below.
Source: US Treasury Fiscal Data: Historical Debt Outstanding
The full Treasury dataset should be treated as the authoritative source when a reader needs every historical observation rather than the selected milestones above.
Major Periods in U.S. National Debt History
The annual numbers become much more useful when viewed alongside the events and economic conditions that caused particularly large changes.
The Early Republic: Building the Federal Government
The United States began its history with significant obligations inherited from the Revolutionary War.
In 1790, the recorded federal debt was about $71.1 million. Treasury's historical series shows that the amount fluctuated considerably during the first decades of the republic as the government borrowed, repaid debt, and managed its finances.
One of the most unusual episodes occurred in 1835, when the recorded federal debt fell to just $33,733.
This is the closest the United States has come to eliminating its federal debt entirely. The debt subsequently increased again, particularly following the financial disruption associated with the Panic of 1837.
The Civil War: A Major Break in the Historical Series
The Civil War produced one of the earliest enormous increases in federal borrowing.
The recorded debt rose from approximately $64.8 million in 1860 to more than $2.77 billion in 1866.
The largest increases occurred during the war itself. Debt rose from approximately $90.6 million in 1861 to $524.2 million in 1862, then exceeded $1 billion in 1863. By 1865, it had reached about $2.68 billion.
The increase illustrates how national emergencies can change the federal government's borrowing requirements within a relatively short period.
World War I: Debt Jumps Into the Billions
Federal debt increased sharply during World War I.
The Treasury series shows debt of approximately $2.92 billion in 1914, rising to about $5.72 billion in 1917 and $14.59 billion in 1918.
By July 1919, the recorded total had reached approximately $27.39 billion.
This was another example of wartime financing producing a rapid increase in federal borrowing.
The Great Depression and World War II
Debt rose gradually during the early years of the Great Depression before accelerating during World War II.
At the end of fiscal year 1930, the recorded debt was about $16.2 billion. By 1940, it had reached about $43.0 billion.
The acceleration became much more pronounced during the war:
1. 1941: $49.0 billion
2. 1942: $72.4 billion
3. 1943: $136.7 billion
4. 1944: $201.0 billion
5. 1945: $258.7 billion
The debt reached approximately $269.4 billion in 1946.
This period is an important reminder that a large increase in the dollar amount of debt does not necessarily mean the same thing economically in every era. The size of the economy and the price level were very different from today.
Postwar Decades: A More Gradual Increase
After World War II, the nominal debt level remained relatively stable for several years.
In fact, the recorded total fell during several fiscal years in the late 1940s and 1950s. For example, debt declined from about $269.4 billion in 1946 to $252.3 billion in 1948.
The debt then gradually increased again, reaching approximately $370.9 billion in 1970 and $620.4 billion in 1976.
The historical series therefore demonstrates that the national debt does not necessarily rise every year. Periods of debt reduction have occurred.
The 1980s: The Debt Passes $1 Trillion
The national debt approached the $1 trillion threshold in the early 1980s.
At the end of fiscal year 1981, total public debt stood at about $997.9 billion.
In fiscal year 1982, it rose to approximately $1.14 trillion, marking the first time the annual historical series ended above $1 trillion.
The debt then continued increasing throughout the decade, reaching about $2.35 trillion in 1987 and $2.86 trillion in 1989.
The 1990s: Debt Growth Slows
The 1990s began with debt of about $3.23 trillion in 1990.
It continued rising through most of the decade, but the pace slowed considerably toward the end of the period.
The annual series shows:
1. 1990: $3.23 trillion
2. 1995: $4.97 trillion
3. 1998: $5.53 trillion
4. 1999: $5.66 trillion
5. 2000: $5.67 trillion
6. 2001: $5.81 trillion
The particularly small increase between 1999 and 2000 stands out compared with later periods.
2008-2009: The Financial Crisis
The national debt was approximately $10.02 trillion at the end of fiscal year 2008.
By the end of fiscal year 2009, it had increased to approximately $11.91 trillion.
The debt then continued increasing substantially, reaching $13.56 trillion in 2010, $14.79 trillion in 2011, and $16.07 trillion in 2012.
This period coincided with the severe financial crisis and recession that began in 2007-2008, along with federal measures taken in response to the economic downturn and financial instability.
The debt increase should therefore be understood within the broader federal budget and economic context rather than attributed to a single factor.
2020-2021: The Pandemic Period
One of the largest year-to-year increases in the modern series occurred in fiscal year 2020.
Total public debt increased from approximately $22.72 trillion in 2019 to $26.95 trillion in 2020, an increase of about $4.23 trillion.
It then reached approximately $28.43 trillion in 2021.
The large increase coincided with the federal government's response to the COVID-19 pandemic, including emergency legislation and other measures that substantially increased federal deficits and borrowing needs.
2022-2026: Debt Moves From $30 Trillion to More Than $40 Trillion
The debt passed several major thresholds during the 2020s.
At the end of fiscal year 2022, total public debt was approximately $30.93 trillion.
It subsequently reached:
1. 2023: $33.17 trillion
2. 2024: $35.46 trillion
3. 2025: $37.64 trillion
4. 2026: $40.17 trillion
The increase from fiscal year 2025 to fiscal year 2026 was approximately $2.53 trillion, or 6.7%.
The Treasury's daily Debt to the Penny data also shows that total public debt first crossed $40 trillion on August 18, 2026, before ending the fiscal year at approximately $40.17 trillion.
What Does "National Debt by Year" Actually Measure?
The figures in this historical series represent total public debt outstanding, commonly referred to as gross federal debt.
The Treasury defines this total as the combination of:
Debt held by the public + intragovernmental holdings = total public debt outstanding.
Debt held by the public includes federal debt held by investors and entities outside the federal government, while intragovernmental holdings represent Treasury securities held by federal government accounts.
The Treasury's Debt to the Penny dataset reports these components and their combined total.
This distinction matters because the national debt is not the same measurement as the federal budget deficit.
The deficit measures the gap between federal spending and federal revenue over a period, usually a fiscal year.
The debt is the accumulated amount of outstanding federal borrowing at a particular date.
Therefore, a $1 trillion deficit does not necessarily mean that gross federal debt will increase by exactly $1 trillion.
Other financing activities, changes in Treasury cash balances, and changes in intragovernmental holdings can affect the relationship between the annual deficit and the change in total debt.
Why Are Historical Debt Figures Not Adjusted for Inflation?
The table above uses nominal dollars: the actual dollar amounts recorded in each period.
That is important because a dollar in 1930 did not have the same purchasing power as a dollar in 2026.
For example, comparing $16.2 billion of debt in 1930 directly with $40.2 trillion in 2026 shows how much the nominal debt balance has grown, but it does not by itself show how the burden compares with the size of the economy or the purchasing power of money.
For historical comparisons, analysts may instead examine:
1. Debt as a percentage of GDP.
2. Inflation-adjusted debt.
3. Debt per capita.
4. Debt held by the public as a percentage of GDP.
5. Federal interest costs relative to federal revenue or GDP.
The Congressional Budget Office uses debt held by the public as a percentage of GDP as an important measure of the federal government's debt burden because it relates federal debt to the size of the economy. CBO's historical and projected debt analysis uses this measure extensively.
This means the nominal historical table should be viewed as a record of the federal government's outstanding dollar obligations, not as a complete measure of fiscal sustainability.
What Is the Difference Between the National Debt and the Deficit?
The simplest distinction is:
The deficit is a yearly flow; the debt is an accumulated balance.
Suppose the federal government starts a fiscal year with $30 trillion of outstanding debt.
If it runs a $1 trillion deficit, it generally needs to borrow to finance that deficit. The resulting debt balance will generally be higher than $30 trillion.
The deficit tells us how much the government fell short during the year.
The debt tells us how much federal borrowing remains outstanding at a particular date.
This distinction is essential when reading a year-by-year debt table. A large increase in the debt does not mean the government "spent that amount on debt" during that year. It means the stock of outstanding federal debt increased by that amount, subject to the effects of other financing transactions.
How Fast Has the U.S. National Debt Grown?
Looking at the historical series reveals several different periods of debt growth.
These are nominal changes calculated from the Treasury historical series. They should not be interpreted as equivalent economic burdens across periods because the U.S. economy and price levels changed substantially over time.
The table nevertheless illustrates the scale of the increase in outstanding federal debt during the modern era.
What Are the Biggest Increases in U.S. Debt History?
Several periods stand out in the historical record.
1. World War II: The debt increased from approximately $43 billion in 1940 to more than $258 billion in 1945.
2. The 1980s: The debt crossed the $1 trillion mark in fiscal year 1982 and exceeded $3 trillion by 1990.
3. The financial crisis period: Debt increased from approximately $10.0 trillion in 2008 to nearly $11.9 trillion in 2009 and continued rising in the following years.
4. The COVID-19 pandemic: Debt increased by approximately $4.23 trillion during fiscal year 2020, one of the largest single-year nominal increases in the historical series.
5. The 2020s: Total public debt crossed $30 trillion in fiscal year 2022 and $40 trillion during calendar year 2026. It ended fiscal year 2026 at approximately $40.17 trillion.
These periods have very different causes and economic circumstances, so the size of an increase alone does not explain why federal borrowing changed.
Why Does the National Debt Sometimes Fall?
Although the long-term trend has been upward, the historical record contains periods when total debt declined.
For example, the Treasury series shows decreases during several years in the 1920s, some years during the late 1940s and 1950s, and numerous years in the late 19th century.
A decline in the outstanding debt generally means the federal government's financial operations allowed it to reduce outstanding obligations during that period.
However, a falling debt balance should not automatically be interpreted as proof that the federal government ran a budget surplus. The relationship between the annual deficit or surplus and the change in gross debt is affected by other federal financing activities.
That is one reason it is important to examine both debt and deficit data when studying U.S. federal finances.
How Current Is the 2026 Debt Figure?
The $40.17 trillion figure is the fiscal-year-end amount for September 30, 2026.
It should not be confused with the latest daily debt figure.
Treasury's Debt to the Penny dataset provides daily debt data and is updated each business day using information from the previous business day.
As a result, an article titled "U.S. National Debt by Year" should use the fiscal-year-end figure for 2026 to maintain a consistent annual series. A separate "current national debt" figure can be displayed elsewhere on the website and updated more frequently.
This distinction prevents the historical table from mixing a fiscal-year-end measurement with a mid-fiscal-year or post-fiscal-year daily figure.
How to Use This Historical Debt Data
A year-by-year national debt series is useful for understanding long-term trends, but the dollar total should not be viewed in isolation.
For a fuller picture, compare the debt with:
1. Federal deficits: Shows how annual spending and revenue gaps contribute to borrowing.
2. GDP: Shows the size of federal debt relative to the economy.
3. Federal interest costs: Shows how much of the federal budget is devoted to servicing debt.
4. Debt held by the public: Provides a narrower measure of federal debt owed to entities outside the government.
5. Inflation: Helps distinguish nominal changes in debt from changes in purchasing power.
This is particularly important when comparing periods that are decades apart.
Conclusion
The U.S. national debt has increased from approximately $71.1 million in 1790 to $40.17 trillion at the end of fiscal year 2026. The path between those two figures has not been linear.
Debt rose sharply during major wars, increased during periods of economic and financial crisis, and experienced slower growth or outright declines during other periods.
The modern annual series shows the debt rising from about $16.2 billion in 1930 to $40.17 trillion in 2026, with particularly large increases during World War II, the 1980s and 1990s, the financial crisis period, and the COVID-19 pandemic era.
The most important point when reading the data is that these are nominal total public debt figures at specific historical dates. They show how much federal debt was outstanding, but they do not by themselves measure the economic burden of that debt.
For that, measures such as debt-to-GDP, debt held by the public, federal interest costs, and annual deficits provide additional context.
The U.S. Treasury's Historical Debt Outstanding and Debt to the Penny datasets remain the primary sources for tracking the federal government's historical and current debt.
Frequently Asked Questions
What was the U.S. national debt in 2026?
The total U.S. public debt outstanding was approximately $40.17 trillion at the end of fiscal year 2026, on September 30, 2026.
What was the U.S. national debt in 2025?
At the end of fiscal year 2025, total public debt outstanding was approximately $37.64 trillion.
When did the U.S. national debt reach $1 trillion?
The national debt first exceeded $1 trillion at the end of fiscal year 1982, when total public debt outstanding was approximately $1.14 trillion.
What was the national debt in 1790?
The Treasury's historical series records approximately $71.1 million on January 1, 1790. The early federal government inherited substantial Revolutionary War obligations.
Has the U.S. ever paid off its national debt?
The United States came very close in 1835, when the Treasury's historical record shows total outstanding debt falling to approximately $33,733. The debt subsequently increased again.
Is the U.S. national debt adjusted for inflation?
No. The historical debt figures in this article are nominal dollar amounts, meaning they are not adjusted for changes in the purchasing power of money. Inflation-adjusted comparisons answer a different question and should be calculated separately.